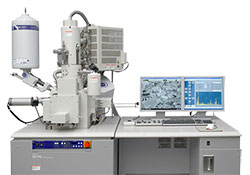
Scanning Electron Microscopy is used for the study of the surface microstructure of many materials and for the analysis of their elemental composition.
The SEM operates in a fashion similar to that of the optical microscope but it uses a beam of electrons instead of light in order to examine objects in detail As the electron beam scans the surface of the sample the ensuing interaction causes the beam to provide information about the morphology and composition of the sample.
SEM is used widely in the study of inorganic coloring substances because of its ability to focus on different micro-granules, of its choice of a wide range of amplification and the minimal requirements for sample preparation.
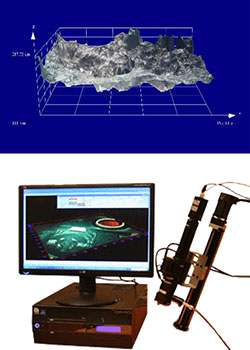
 Is the next generation digital microscope in video zoom optics: designed on a modular basis, it allows easy choice of magnification, field of view and working distance and it can be customized with various camera, lighting, stand, software and measurement options. The lens offers superior resolution with internal focus and iris adjustments. Detent click stop feature is ideal for video measurement application. None detent click stop version is also available for general application.
With a numerical aperture of 0.018 0.1 and a nominal zoom range of 0.58 7x (dynamic magnification range .07 to 583x), the 12x is the only single lens system to provide such a high combination of zoom range and resolution. This combination of video clarity and zoom range, coupled with unprecedented field coverage, offers the flexibility to view a wider range of parts with a single video inspection system. Other characteristics: variable working distance from 37 to 334 mm, field of view from 0.01 mm to 83 mm with attachments, unmatched edge flatness and clarity, works with 1/4, 1/3, 1/2 and 2/3 format cameras.
Our lab has the following modules:
12x Ultra-Zoom Lens system. With infinity corrected objectives the resolution can exceed 1,650 lines/mm, depending on the objective used. Coaxial illumination. Fine focus 3mm control with 2-phase stepper motor.
Infinity corrected objectives 5x and 20x with N.A. of 0.14 and 0.42 respectively. Working distances 34 mm and 20 mm respectively. With these lenses and appropriate adapters the system magnification can vary between 2.8x and 133x.
High quality image processing software.
COLOR – COLORIMETRY
The word colour is ambiguous, because the colour of an object depends on both the physics of the object in its environment and the characteristics of the perceiving eye and brain. Physically, objects can be said to have the colour of the light leaving their surfaces, which normally depends on the spectrum of the incident illumination and the reflectance properties of the surface, as well as potentially on the angles of illumination and viewing. Some objects not only reflect light, but also transmit light or emit light themselves, which also contribute to the colour. The ability of the human eye to distinguish colours is based upon the varying sensitivity of different cells in the retina to light of different wavelengths.The eye perceives luminous sensations by means of four kinds of cells on the retina: one kind is called rods, while the other cones, which of themselves are of three kinds – long, medium and short cones (color-blind people might not have all three). Cones are capable of distinguishing colour (by the very definition of “color”) as well as intensity of light. Long, medium and short cones are so called because their sensitivity peak is situated in long, medium and short wavelengths (respectively around 570nm, 543nm and 442nm). They do not play a symmetric role: long and medium cones participate in the sensation of brightness or luminosity, whilst short cones contribute much less, if at all, to this sensation. A lot of people, commonly but misleadingly, call the three cone kinds “red”, “green” and “blue” instead of “long”, “medium” and “short”. Colours with different spectral compositions can look alike. An important function of colorimetry is to determine whether a pair of such metameric colours will look alike. It has long been the practice in colorimetry to make use of sets of colour-matching functions to calculate tristimulus values for colours: equality of tristimulus values for a pair of colours indicates that the colour appearances of the two colours match, when they are viewed in the same conditions by an observer for whom the colour-matching functions apply. The use of standard sets of colour-matching functions makes the comparison of tristimulus values obtained at different times and locations possible. Colorimetry is used extensively for identification and determination of concentrations of substances that absorb light. In colorimetry, frequently the entire visible spectrum (white light) is used, and consequently the complementary colour of the one absorbed is observed as transmitted light.
• Fast measurement on steel or iron (F) and non-ferrous metals (NF)
• Automatic probe and base material recognition
• Large colour display
• Supports measurements according to several protocols
• USB interface, Bluetooth or COM interface as option
• Over 70 various high-precision probes can be connected to the instrument family (6 different base instruments) for even the most sophisticated measurement applications. A probe has to comply with different specifications for each field of application for achieving best results with high accuracy.
Probe selection is based on several criteria
• Material combination of coating and base material
• Thickness of coating and base material
• Dimension of the measurement area
• Shape of the specimen
• Surface condition of the measurement area
 The research center “NIKIAS” is equipped with the Fischer ISOSCOPE FMP30, based on the Eddy current method (DIN EN ISO 2360, ASTM D7091). It is suitable for the measurement of paint, powder coating, lacquer or plastic coatings on non-ferromagnetic metal base materials (NF) or anodic coatings or aluminum and electrically conducting coatings on non-conducting carrier materials. Features
Storable measurement applications: up to 100 incl. calibration (adjustment settings)
Statistics, evaluation
• Display of the most significant statistical values (number of measurements, mean value, standard deviation, min, max, range) and specific values
• Tolerance monitoring
• Graphical evaluation
Measurement strategies and evaluation
• Capability to enable matrix measurement mode for correlated multi-point measurements
• Averaging of measurement data: Only the mean value of several readings will be stored
• Measurement acquisition through area measurement: Single readings are captured until probe lift-off and averaged
• Free-running display with additional presentation of the reading as an analog bar between the tolerance limits
• Statistics display of the most significant values in the block and final results. Output of variance-analytical values
• Graphical measurement display as a histogram
 In Physical Metallurgy the hardness of a material is defined as the resistance of this material to vertical penetration by another material of greater hardness.Hardness is measured in a way that makes it inversely proportional to the observed penetration. Different devices and methods have been employed for the measurement of hardness.
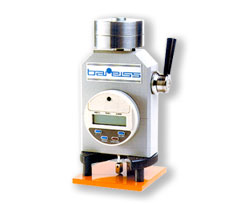
The NIKIAS Research Center uses a Hardness Meter that is especially designed to measure the hardness of colors.


